
Dashboard room
Your numbers, live, on one canvas
A drag-and-resize reporting canvas. Stat tiles, progress bars, bar and donut charts, and recent-cards tables wired live to your boards. The Friday report builds itself.
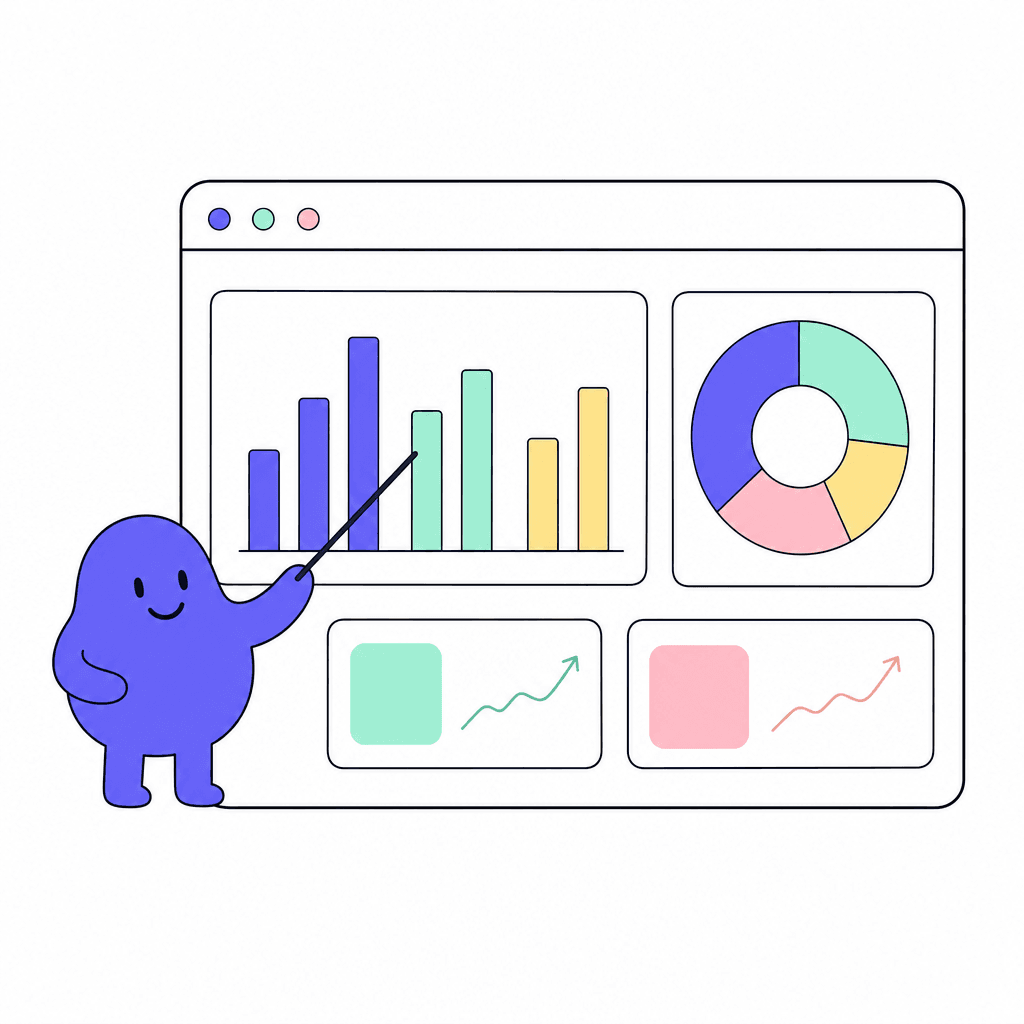
Dashboard turns board data into a report that stays current. Drag widgets onto the canvas, resize them until the layout reads well, and wire them live to your Table and Kanban boards. Stat tiles for the headline numbers, progress bars for goals, bar and donut charts for breakdowns, recent-cards tables for the latest activity.
Not everything lives on a board, so manual-data widgets let you chart numbers you enter yourself, and text widgets add the context that makes a dashboard readable. Build it once; it updates as the boards do.
What you get
Everything inside Dashboard
Drag-and-resize canvas
Arrange widgets by dragging and resizing until the story reads top to bottom. Your layout, not a fixed grid of boxes.
Live board wiring
Widgets connect directly to your boards and update as the data changes. No exports, no screenshots, no Friday copy-paste.
Stat tiles and progress bars
Put the headline numbers and goal progress front and center, where a glance answers the first three questions.
Bar and donut charts
Break work down by status, owner, or group with charts that draw themselves from board data.
Recent-cards tables
Show the latest cards from a board right on the dashboard, so the report links straight to the actual work.
Manual data and text
Chart numbers that live outside your boards and add text widgets for context, targets, and commentary.
Made for moments like these
- A sales dashboard with pipeline stat tiles wired live to the deals board
- A sprint health view showing progress bars and a recent-cards table
- A department overview mixing board charts with manually entered revenue numbers
- A screen for the team room that's never out of date
One less tool to pay for
Teams typically use Dashboard to replace:
See how Openbook stacks up in our comparison guides.
FAQ
Common questions
Where does dashboard data come from?+
Two places. Widgets wire live to your Table and Kanban boards, so tiles, charts, and recent-cards tables update as the boards change. Manual-data widgets cover numbers that live outside Openbook, entered by hand and charted alongside the rest.
Do dashboards update automatically?+
Yes, for board-wired widgets. They read live from the boards, so when a deal moves stage or a card closes, the dashboard reflects it. The report you built in January is still accurate in June.
Can non-technical people build dashboards?+
Yes. It's drag and resize: pick a widget, point it at a board, place it on the canvas. There's no query language to learn. If you can arrange slides, you can build a dashboard.
Which plan includes dashboards?+
Dashboards are part of the Pro plan, at $15 per user per month ($12 annual), which comes with a 14-day free Pro trial. The free plan includes all 18 room types so you can try the rest of Openbook first.
Add a Dashboard room in seconds
Every room type is included on the free plan. Compose the workspace your team deserves.